
How a brand presents itself on social media often varies depending on the industry. This can mean how often a brand posts, which platforms it uses, the style of posts, time of day, how it interacts with customers, and even how it interacts with other brands. Some industries will have a more successful social media presence when certain metrics are increased, whereas other industries will thrive when those metrics are lowered. Taking a look at social media benchmarks can give a brand a better understanding of what their social media presence should look like compared to other brands in the same industry.
It is important that brands understand the averages for certain social media benchmarks in the industry, as it will help the brand stay relevant and noticed in a competitive market. Conducting a competitive analysis will help determine how to position a brand on social media based on industry. Take a look at the numbers described in each metric below to understand how your brand should be utilizing social media marketing in your industry.
Daily Posts
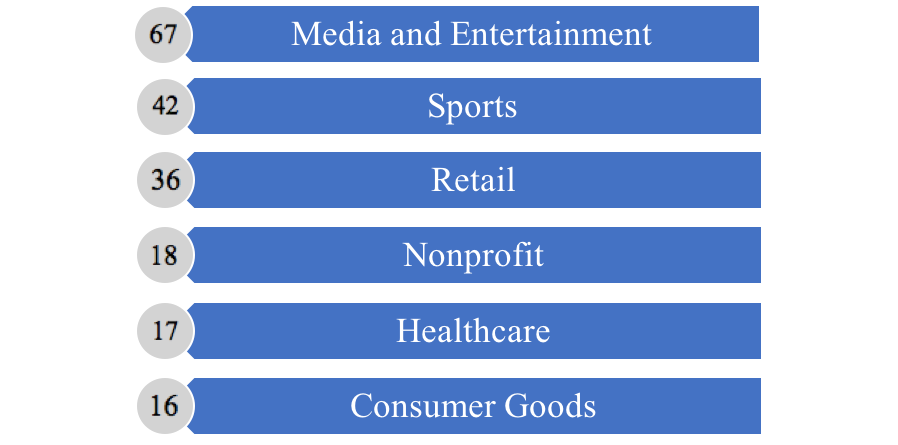
The average number of posts brands make per day for all industries are 28. This includes all public postings across multiple platforms and any replies to consumers. This number can change for each industry depending on how prominent a brand’s customer service on social media might be, or how much information a brand wants to submit to the public. Industries such as media, entertainment, sports, and retail typically have a higher average benchmark for daily posts. Industries such as nonprofit, healthcare, and consumer goods generally have a lower average amount of daily posts. The chart below shows the averages of daily posts per industry from the most amount of posts to the least.
 Engagements Received by Consumers
The average number of engagements per day that brands from all industries receive from consumers is 307. The average number of engagements a brand will receive per day on a single post is 13. Engagements include any time a consumer reacts to, likes, or reposts public content submitted by a brand. Checking on the average engagements your brand receives per day compared to the average number of engagements received per industry can give your brand insight on how well your brand is performing on social media compared to your competitors. Media, entertainment, sports, software, internet and technology are the industries that have higher averages of engagements per day. Finance, banking, education, and real estate have a lower average of daily engagements received from consumers.

Engagements Sent by Brands
The average number of engagements a brand sends per day on other users’ accounts is 11. This means any time a brand reacts to, likes or reposts content from another brand or user. It is important for brands to actively engage with relevant posts because consumers will see it, as well as the owner of the accounts. It is a good way for the brand to be noticed as an alternative to standard posts. Industries that engage with other accounts more than the average are media, entertainment, software, technology, and sports. Industries that engage with other accounts less than the average are nonprofit, education, and real estate.
Messages Received
On average, brands across all industries receive 59 messages per day on social media. Similar to the benchmarks on engagements received, certain industries that rely on social media for customer care will have a higher average for messages received per day. The industries with the highest average messages received per day are sports, media, entertainment, and nonprofit. Industries that typically receive fewer messages per day are education, health care, and real estate.

Social Media Benchmarks for Different Platforms
The metrics for social media benchmarks change for each industry for different platforms. Some industries perform better on certain platforms, where others don’t. Brands across all industries post an average of 7 posts per day on Facebook. Twitter has an average of 6 posts per day across all industries, and Instagram has the lowest average of 5 posts per day.

Taking a look at the benchmark averages above for each industry can give a brand a better idea of how they should be presenting themselves on social media. Each industry has its own unique competitive market, and understanding the competition can ultimately help a brand be more successful on social media.